The Site Reliability Engineering Journey
Briefly explained, Site Reliability Engineering (or SRE, for short) is a discipline created at Google that devises actions, goals and a whole culture that should be applied to a software team/company that intends to have highly scalable, reliable and available services and systems.
Oblivious to the fact that such a discipline already existed, some months ago I started to get into systems reliability and was formulating ways to make SAJ ADV’s systems and services more resilient. Part of it was due to a program we have here, called “Maturidade por Faixas”, which sets levels for the development teams to reach, based on the skills the team has for Team Culture, Projects Architecture, DevOps and Bussiness. On the Projects Architecture category, one item in the list is SRE and SLO (explained below). Luckily, I also stumbled upon a post on Hacker News, about Google’s new book on SRE “The Site Reliability Workbook”, which was available for free. Of course I started to read it!
The first items from Google’s book that I decided to apply here were SLIs, SLOs and Health Checks, which were items that my team would need to present to the “Maturidade por Faixas” program. Below, a brief description of these items:
- Health Checks
The simplest of the three, a health check is just a way to verify that a given service or system is running and behaving as expected. The usual way to implement it in a web system is to provide an endpoint like random-service-health-check, that gives an overview of the system’s status.
- Service Level Indicator (SLI)
It describes the metrics used to monitor the system in a given timeframe. For example, average response time when accessing the system, in microseconds, in the last 30 minutes is one such indicator.
- Service Level Objective (SLO)
It sets a goal for the system, based on a related SLI. Based on the SLI defined above, a possible SLO could be average response time when accessing the system, in microseconds, in the last 30 minutes LESSER THAN 100ms. And if the average response time for the system in this timeframe was to be higher than 100ms, the system would be breaking its SLO and should trigger an alert.
Behold, SRE!
Before I started this SRE journey, our only option when asked the question “what’s the average response time for the system?” would be to check NewRelic’s monitoring page and interpret some of its data on the fly. The same for when we wanted to know which system’s the slowest, or the faultiest. Now, some of these questions are easier to answer, because we have the following in place:
-
SLIs for any service we can monitor with NewRelic and StatusCake
-
SLOs for our three most important services, our database and one additional service
-
Alerts for every corresponding SLI and SLO, that warns us at a Slack channel
-
More health checks (the more the merrier (⌐■_■))
Service Level Indicators
When creating the Service Level Indicators, I had some problem devising the exact metrics to use, so my advice to beginners is to use a monitoring tool like NewRelic, check its possible alerts and create the first SLIs based on them. You can improve later, but you have to start somewhere. Below, the SLIs I created for my team (with strategic information redacted):
| Indicator | Metric | Purpose | Possible Alerts |
|---|---|---|---|
| Apdex | Application Performance Index | Availability + Errors + Latency | Apdex score below Y at least once in 5 mins Apdex score below X for at least 5 mins |
| Availability | Health Checks, expecting HTTP 2xx | Is the service up when I need it? | 3 attempts to connect every X minutes |
| Errors | HTTP 5xx errors | Does the service throw an error when I use it? | Error percentage above Y% at least once in 5 mins Error percentage above X% for at least 5 mins |
| Latency | Web Transactions | Does the service respond fast when I use it? | Average above Y sec at least once in 5 mins Average above X sec for at least 5 mins When 95th percentile of target application response time is above Y sec at least once in 5 mins When 95th percentile of target application response time is above X sec for at least 5 mins When 99th percentile of target application response time is above Y sec at least once in 5 mins When 99th percentile of target application response time is above X sec for at least 5 mins Response time has a maximum above Y sec at least once in 5 mins Response time has a maximum above X sec for at least 5 mins |
| Memory | Memory used by the JVM | Is the instance overloaded by the request? | Heap memory usage has a percentage above X % at least once in 5 mins Heap memory usage has a percentage above Y % for at least 5 mins |
| Volume | Requests per Minute that the system is able to serve | How much business volume can my service handle? | |
| SLAs | Amount of Service Level Agreement tickets the customer service receives | Does the service require manual intervention to complete my request? | Jira report |
Service Level Objectives
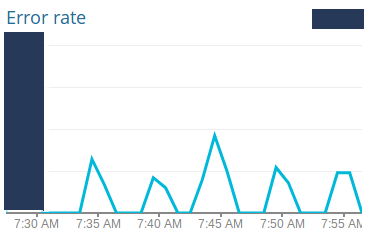
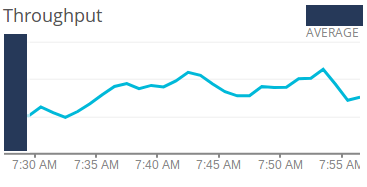
As you can see above on the SLIs table, the “Possible Alerts” column pretty much describes the alerts that I was going to create on NewRelic and StatusCake. What I did when creating the Service Level Objectives the first time, was to look at NewRelic’s and StatusCake’s dashboards, devise the current status of the services, and create objectives slightly below these statuses. Some of the dashboards I used include latency, errors, throughput, apdex, availability, and more. Examples (with strategic information redacted):
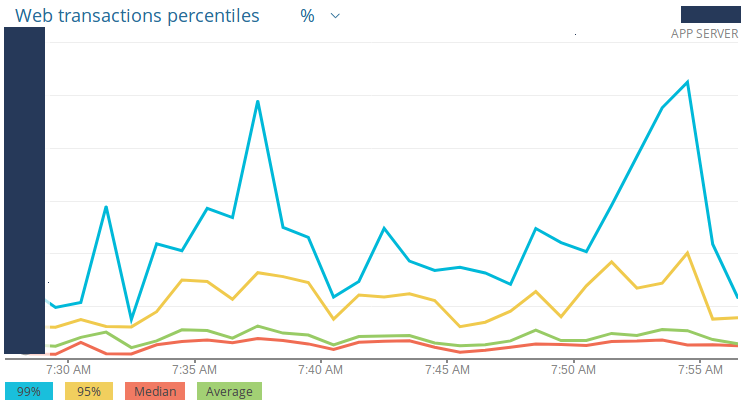 Latency
Having this historical data on the behavior of our systems, I created the threshold for each service being monitored and each indicator created above. These thresholds were then validated and agreed upon by me, my technical leader, the development manager and the product manager.
Alerts
With the SLOs in place, I setup the actual alerts, based on the SLOs’ thresholds and on the SLIs’ “Possible Alerts” column. Below, an example of a New Relic alert for latency. The alert for system X will trigger if its latency passes below a Y threshold at least once in a 5 minutes timeframe:
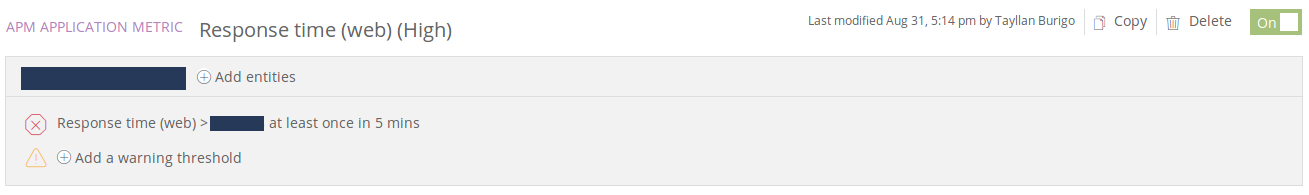
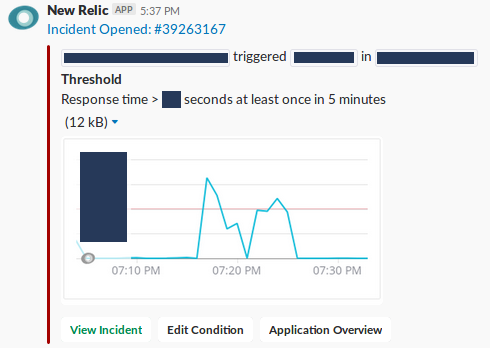
And a triggered alert notifying our Slack channel:
Lessons learned
False-positive, non-actionable alerts exist to take your system down!
Because I created the thresholds based on historical data, very often we’d get alerted by a system failing its SLO. The system was not misbehaving or running poorly, the SLO was simply too rigid. After some days of false-positive alerts, even the most SRE-commited engineer will start to resent and ignore or block them. That’s when bad things happen, and systems go down.
NewRelic-based SLIs are a good starting point
Albeit I didn’t read any recommendation like this, having NewRelic’s possible alerts as a base for the SLIs really helped and made things smoother.
Without a SRE-dedicated team, it’s challenging to keep the culture
Already I can sense this in my team. Because SRE is not our primary focus, keeping the SLIs and SLOs updated and in check demands an extra effort.
Future endeavors
All in all, these first steps were easy and brought value to my team, but there’s much more to do to foster the SRE culture, like:
Create SLOs for every service we have
The next logical step is to put all of our services under the SRE umbrella, by defining their SLOs, adding health checks and setting up alerts.
Create stress tests
Once we have enough services with defined SLOs, it becomes interesting to have stress tests under our build and deploy pipelines that check if changes to the code base will hinder the services’ performance.
Specify and measure error budget
An error budget is the amount of downtime or bad performance your system is allowed to have. For example, for an SLO of 99,99% availability per month, the system can be down for little more than 4 minutes in the whole month.
Error Budget gives teams a way to prioritize incidents response, bug fixing and resilience-related features to work on.
Create actionable documentation for incidents
Some documentation, with simple and actionable steps, would great benefit my team when dealing with incidents. We have some common incidents, which have been more and more mitigated, that are easy to solve but that demand very specify knowledge that not everybody in the team has. This was easier to see as we started to get new people on-board.
This post grew more than anticipated, so I left Blameless Postmortems out and I’ll bring the subject back on its own future post.